Case study · EYDAP Innovation Challenge 2021–22
Winner · Best demand forecasting ML modelForecasting water use, one meter at a time.
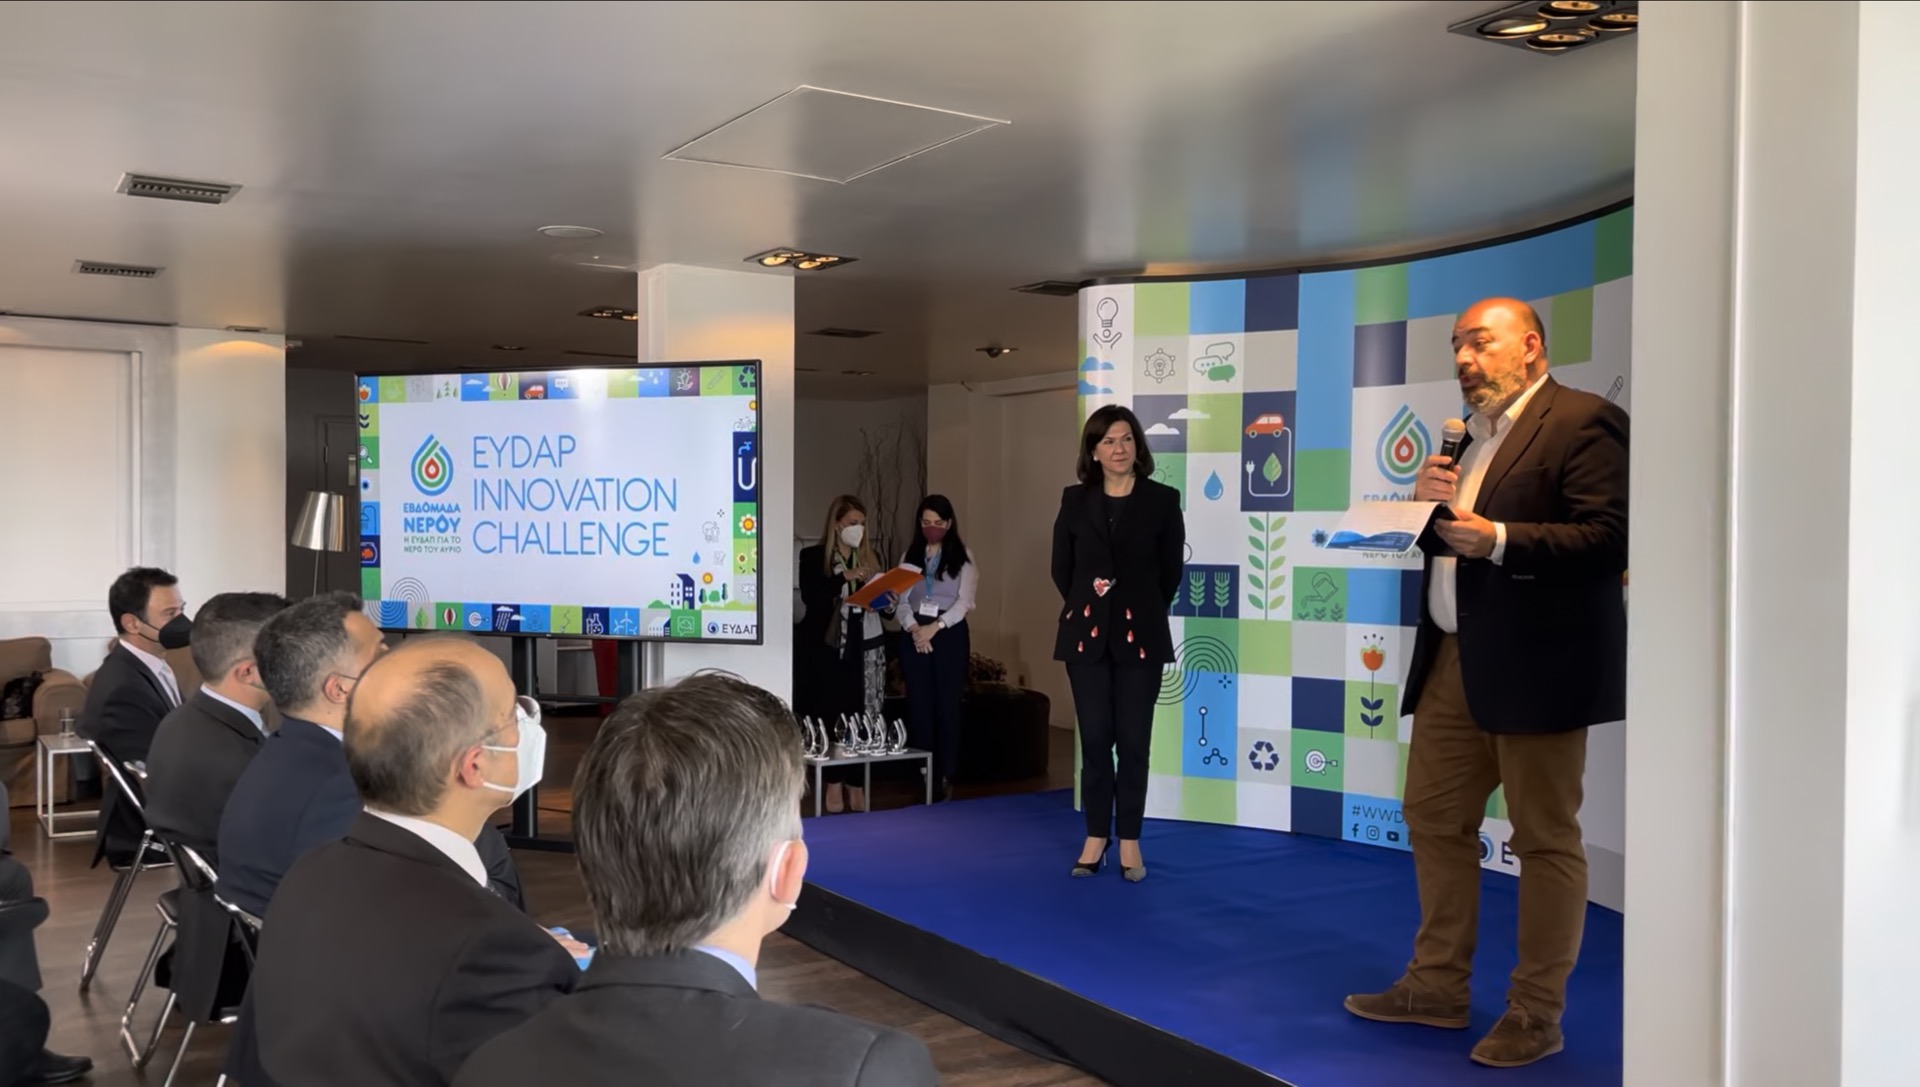
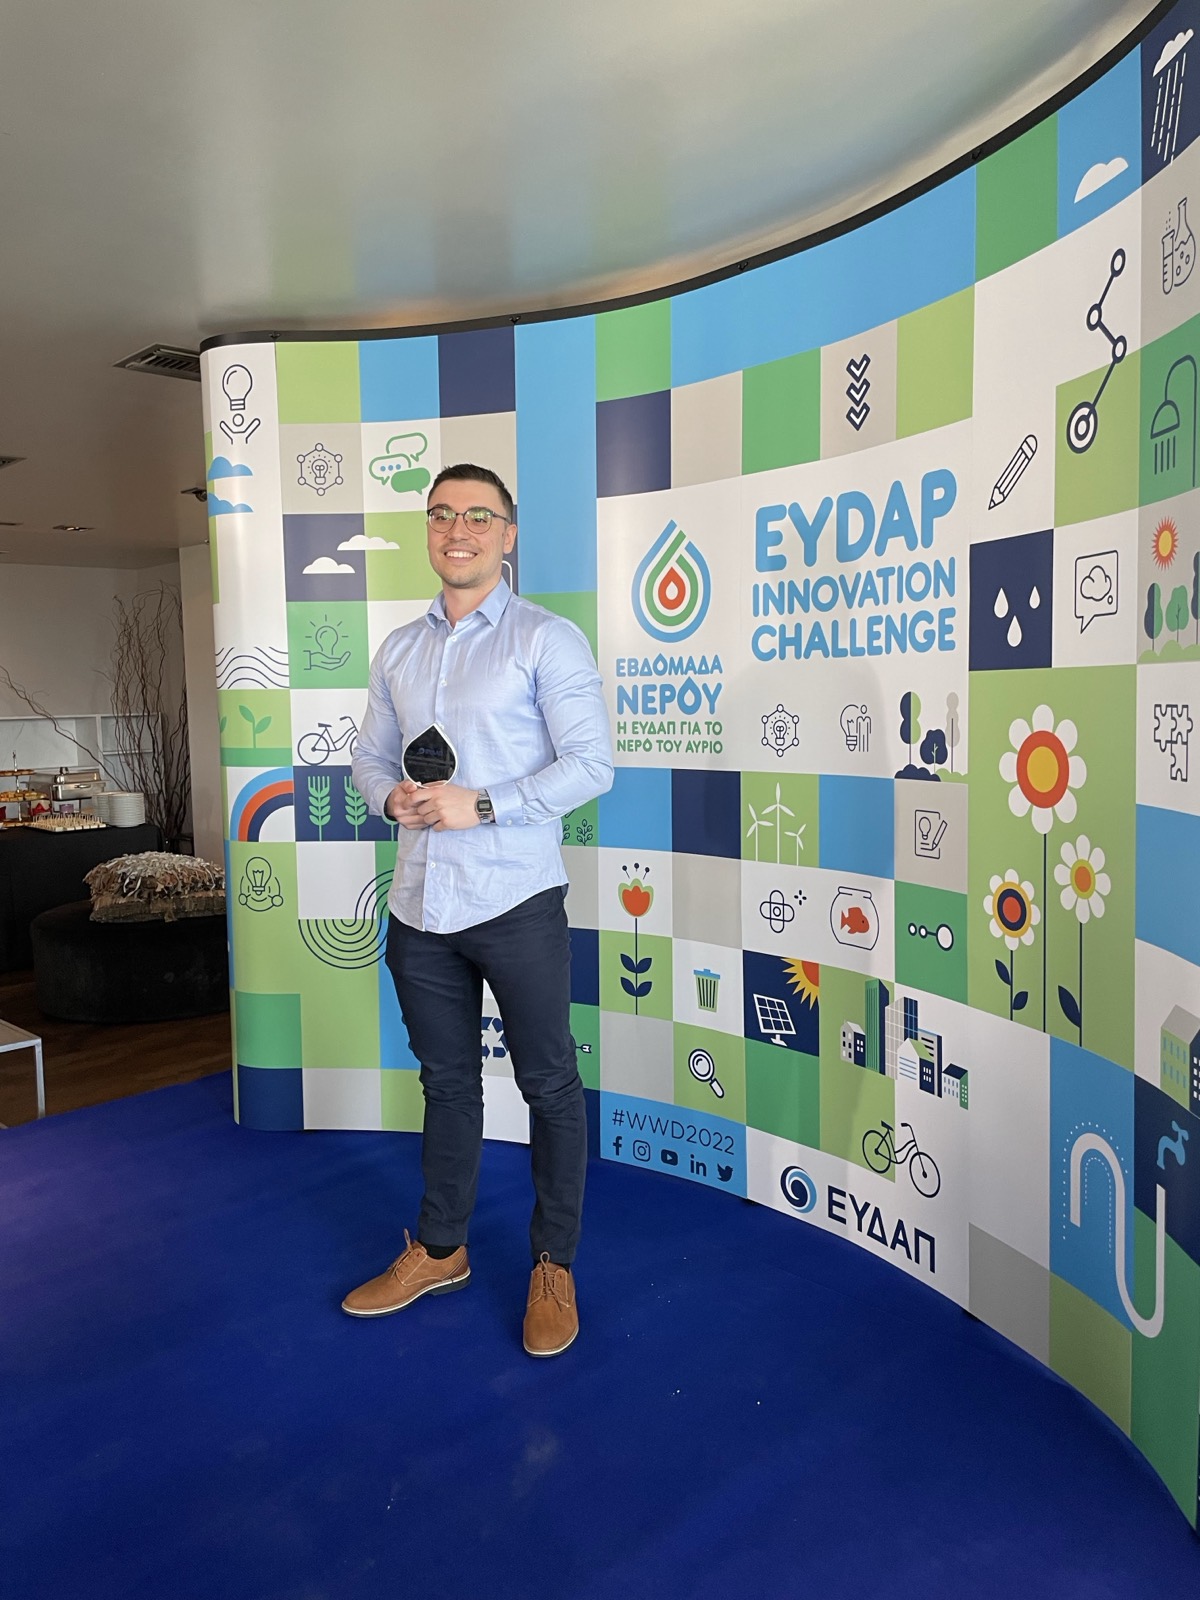
EYDAP, the water company for Athens, the capital of Greece, opened ten years of meter readings to anyone who could forecast what each supply point would consume next. 162 teams applied. Panagiotis Papaemmanouil, who went on to found DataMinds, took first prize in the forecasting challenge.
162
Applications
23
Forecasts submitted
€15k
First prize
1
Follow-on contract
In the news

EYDAP InnoChallenge: the challenge page at the HCAP Innovation Network, from brief to results

A 26-year-old from Drama innovates with algorithms and takes first prize at EYDAP's competition

The projects and startups distinguished at the EYDAP Innovation Challenge

The projects and startups that were distinguished in the EYDAP Innovation Challenge

EYDAP Innovation Challenge: the startups changing how water is managed

EYDAP Innovation Challenge: the startups recognised for their innovative solutions

The EYDAP Innovation Challenge prizes are awarded

More than 150 applications for the EYDAP Innovation Challenge
EYDAP: applications for the digital innovation competition pass 150

Panagiotis Papaemmanouil, the winner of EYDAP's innovation competition
In the coverage the entry appears under its team name, Dropouts.
Awards ceremony
The awards, streamed live by EYDAP.
EYDAP's live stream of the ceremony on 24 March 2022: the four prizes across the two challenges, the chair and the chief executive of EYDAP, and the Deputy Minister for Research and Technology. In Greek.
The result
First prize in forecasting, out of 23 submissions.
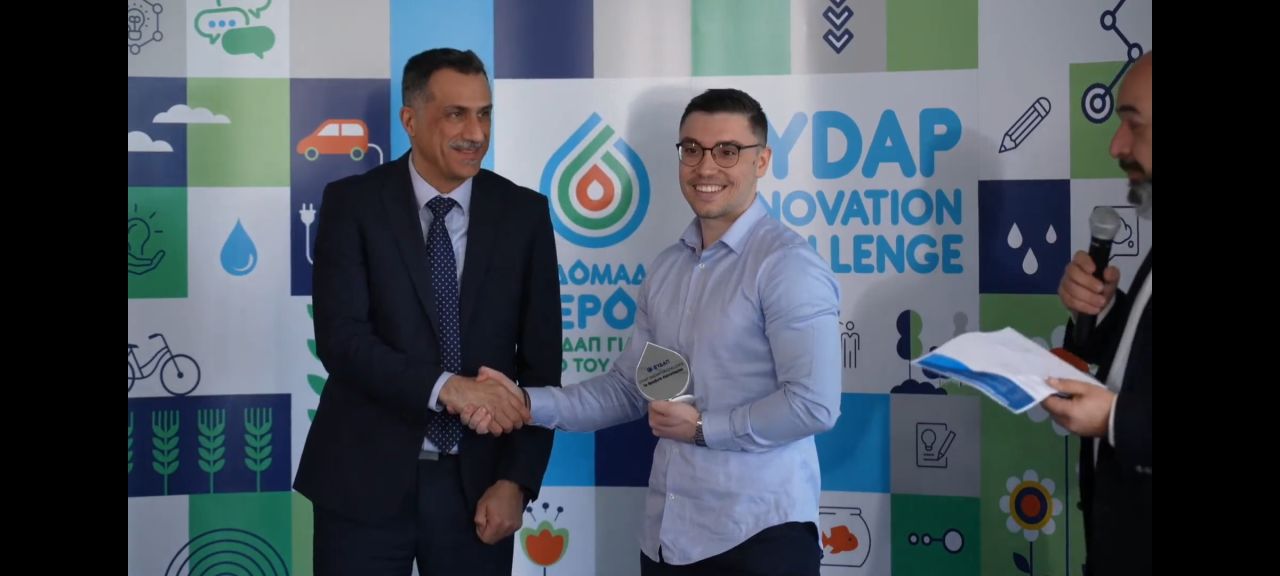
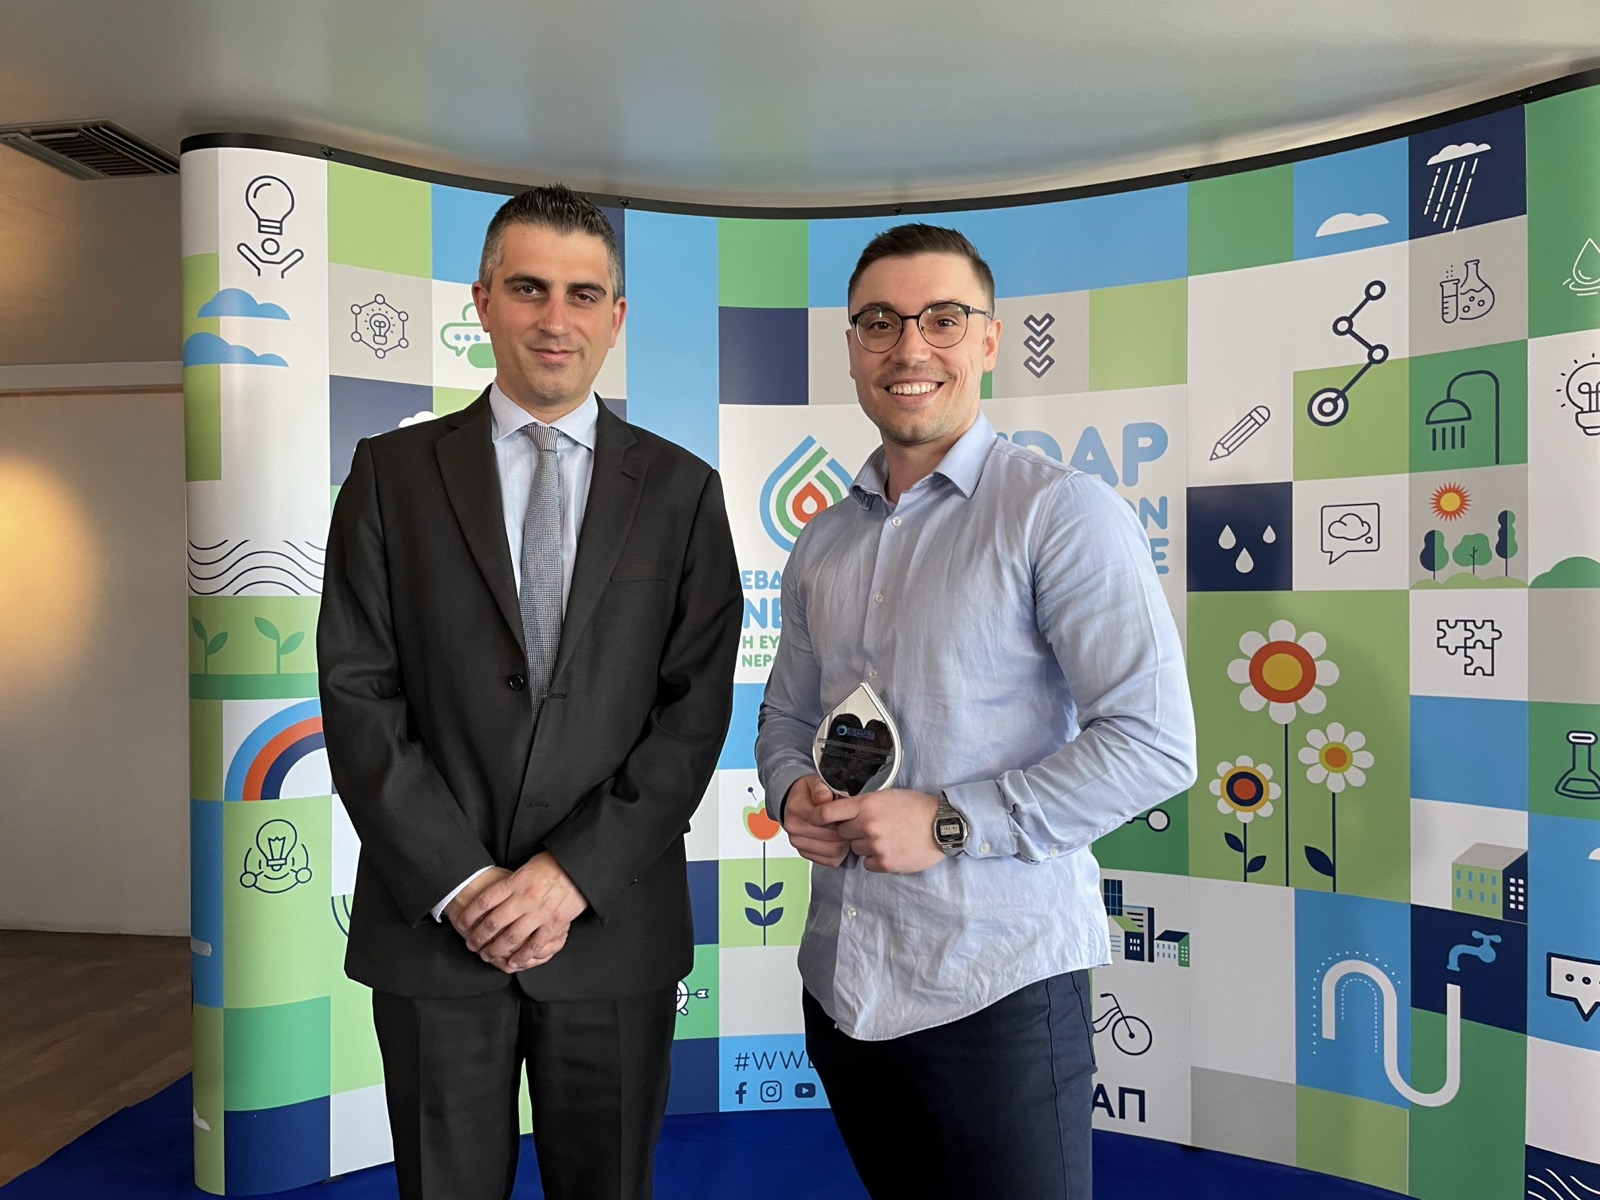
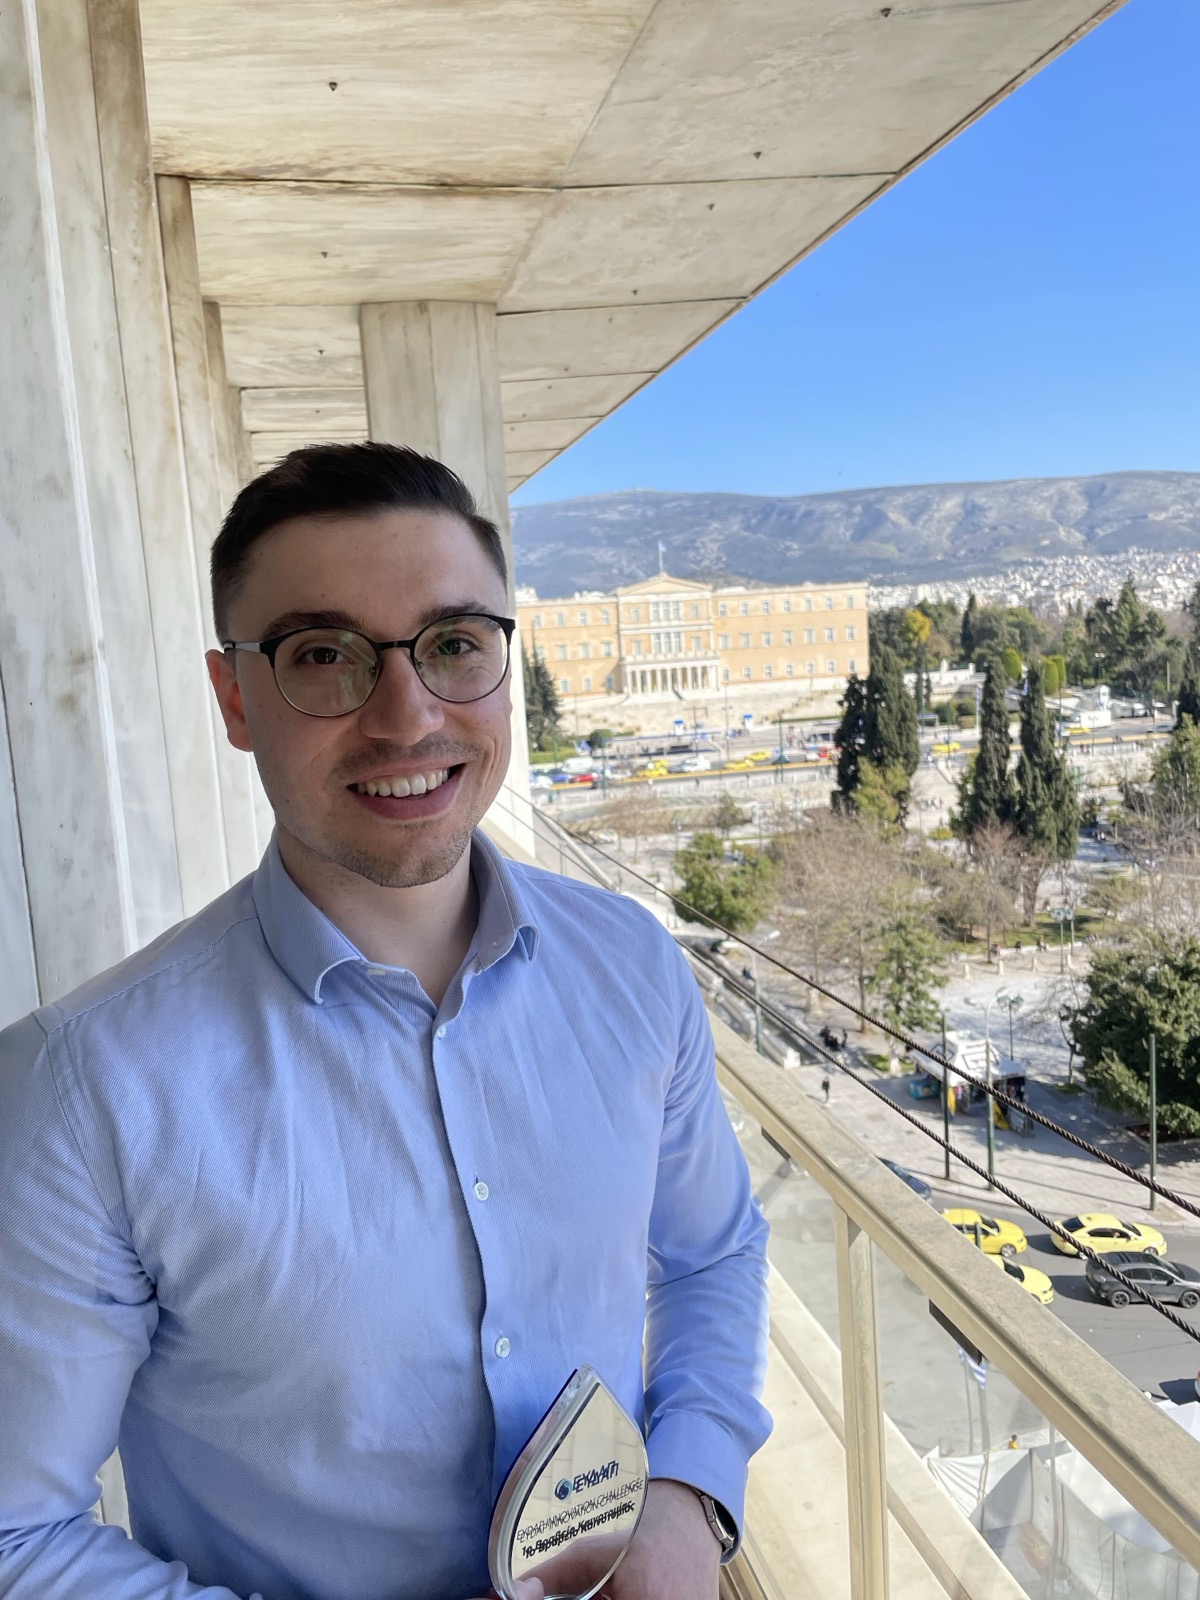
Four prizes were awarded in Athens on 24 March 2022, two for each challenge. In consumption forecasting the first went to Panagiotis Papaemmanouil, ahead of established companies and research groups. Libra AI took the second. Wings ICT Solutions and Core Innovation won the faulty-meter challenge.
There was no pitch to win. EYDAP held back the real readings that followed the data and measured every forecast against them. A deviation above 10% did not qualify for a prize, and among the rest the lowest won. That is the test we would choose ourselves.
It is also where DataMinds began. The forecasting work became our first production system, for EYDAP.
The organisers

Athens Water Supply and Sewerage Company
Greece's largest water and sewerage company, supplying about 2.2 million households and businesses across Attica. It set the two challenges, released the data under a confidentiality agreement and ran the mentoring workshops.

The Greek chapter of the MIT Enterprise Forum
A non-profit founded in 2013 that runs programmes and a startup competition for technology founders. It hosted the launch presentation and coordinated the peer review of the 162 applications. Now StartSmart South Eastern Europe.

The National Fund of Greece, formerly HCAP
The state holding company for public enterprises in Greece, EYDAP among them. Its Innovation Network created the HCAP Incentivized Competition Series, and this challenge was the first in it.
The challenge
Four readings a year, for 2.2 million supply points.
EYDAP is the largest water and sewerage company in Greece. It supplies about 2.2 million households and businesses across Attica through conventional meters read by hand, some 30,000 readings a day, each roughly a quarter apart, on a calendar that differs from meter to meter and area to area. Bills wait for the reader, and every reading has a cost.
The challenge asked one question. From ten years of readings, what will each supply point consume in each of the coming quarters? A forecast EYDAP can trust lets it issue interim bills, accept readings from customers and send fewer people into the field. The answer was scored against real readings the company held back, with no credit for anything more than 10% off.
The data
Ten years of readings, one forecast per meter.
Everything arrived as CSV under a confidentiality agreement: real, manual and irregular. Turning the readings into a series a model can learn from was most of the work.
10 years
Consumption readings
Every manual reading for about 100,000 supply points, up to 2018. Roughly quarterly, but the dates shift from meter to meter and the gaps are uneven.
Per supply
Supply changes
The status of each supply over time and every change of owner or tenant. A move is the moment a consumption pattern breaks.
Per meter
Meter and location
Type of meter, installation date and the coordinates of the supply point, shifted by a fixed offset to protect addresses.
Open data
External sources
Anything freely available was allowed: weather, holidays, pre-trained models. Nothing could be fetched at run time. The notebook had to run offline.
Held back
The test readings
The readings that followed the sample, never released. Every submitted forecast was scored against them after the deadline.
The bar
10%
the most a forecast could deviate from the real readings and still qualify. Among the qualifiers, the lowest deviation won.
Four readings a year, on a calendar that shifts from meter to meter. There is no clean quarterly series to start from. You have to build one.
How we built it
Respect the calendar. Then model it.
The rules allowed any method, any language and any public data. The hard part was not the model. It was a validation that matched how EYDAP would score us, and features that held up on an irregular reading calendar.
01
Fix the meter IDs before anything else
The ten-year readings file arrived with meter identifiers that did not line up. A supply point could carry several meter IDs over the decade, and some supplies were unusable outright. The first notebook did nothing but repair that: which IDs belong together, which supplies to set aside, and a clean readings table to build on.
02
Validate the way EYDAP would score
EYDAP kept the readings after the sample and would score every forecast against them. So did we. A validation set was cut from the end of every series, with its own list of supply points, and no experiment was trusted until it beat the last one there. Twenty experiments later, the model was settled.
03
One grid, every supply, every period
The pipeline follows the shape of the M5 forecasting competition. Readings on an irregular calendar were laid onto a regular grid of supply point by period, and the features live on that grid: the same period a year and two years earlier, recent trend, season, meter and location. Doubled readings and outliers came out in a separate pass, and the effect was measured, not assumed.
04
Machine learning on the grid, deep learning on the side
Gradient boosting on the engineered grid did the work. Sequence models on the raw series were tried alongside it, on rented cloud GPUs when the laptop ran out of room. Two submission files came out of the final runs; the one that did better on validation was the one sent.
05
A notebook EYDAP could rerun
Four notebooks and a README: repair the IDs, cut the validation, build the grid, train and predict. It runs offline, within the CPU limit, with no custom packages and no calls to the internet, and ends in a single CSV with a forecast for every supply point.
Timeline
Thirteen months, application to award.
Jan 2021
Applications close on 9 January. 162 teams apply; 76 are selected and invited into the mentoring programme.
Feb 2021
Confidentiality agreements signed and the data delivered by 2 February. First look at ten years of readings.
Apr 2021
First mentoring workshop, 22 April. Every question the teams had sent in is answered there.
Jun 2021
Second mentoring workshop, 30 June. The remaining questions on the data and the scoring settled.
Jul to Aug 2021
Two months of full-time work: the reading calendar, the validation, the features, the models. Cloud compute rented when the laptop ran out of room.
Sep 2021
Submission deadline, 1 September. A single notebook, runnable offline, with a forecast for every supply point.
Autumn 2021
EYDAP scores every forecast against the readings it held back. For the faulty-meter challenge, more than 350 meters are pulled and tested in the lab.
24 Mar 2022
Awards ceremony in Athens, streamed live. First prize in demand forecasting.
Demand you cannot see coming?
Water, energy, orders, stock. If your planning still runs on last year plus a percentage, we build the forecast that replaces it, with the uncertainty shown. First results in weeks.