Case study ·HEDNO Datathon 2023
Winner · Best fraud detection ML modelFinding power theft across a national grid.
HEDNO, the operator of Greece's electricity distribution network, opened real consumption data to anyone who could find the meters being tampered with. 267 teams entered. DataMinds took one of the three prizes.
267
Teams entered
10
Finalists in Athens
€10k
Prize won
2
Follow-on contracts
In the news

Artificial intelligence to detect power theft at HEDNO
The winners of HEDNO's innovation competition on power theft

HEDNO: AI for the detection of power theft

HEDNO takes artificial intelligence into the fight against power theft

HEDNO puts a stop to power theft

HEDNO completes its innovation competition on detecting power theft

First HEDNO Datathon: the innovation competition prizes are awarded

Artificial intelligence to detect power theft at HEDNO

HEDNO completes its innovation competition on detecting power theft

Prizes awarded at the first HEDNO Datathon
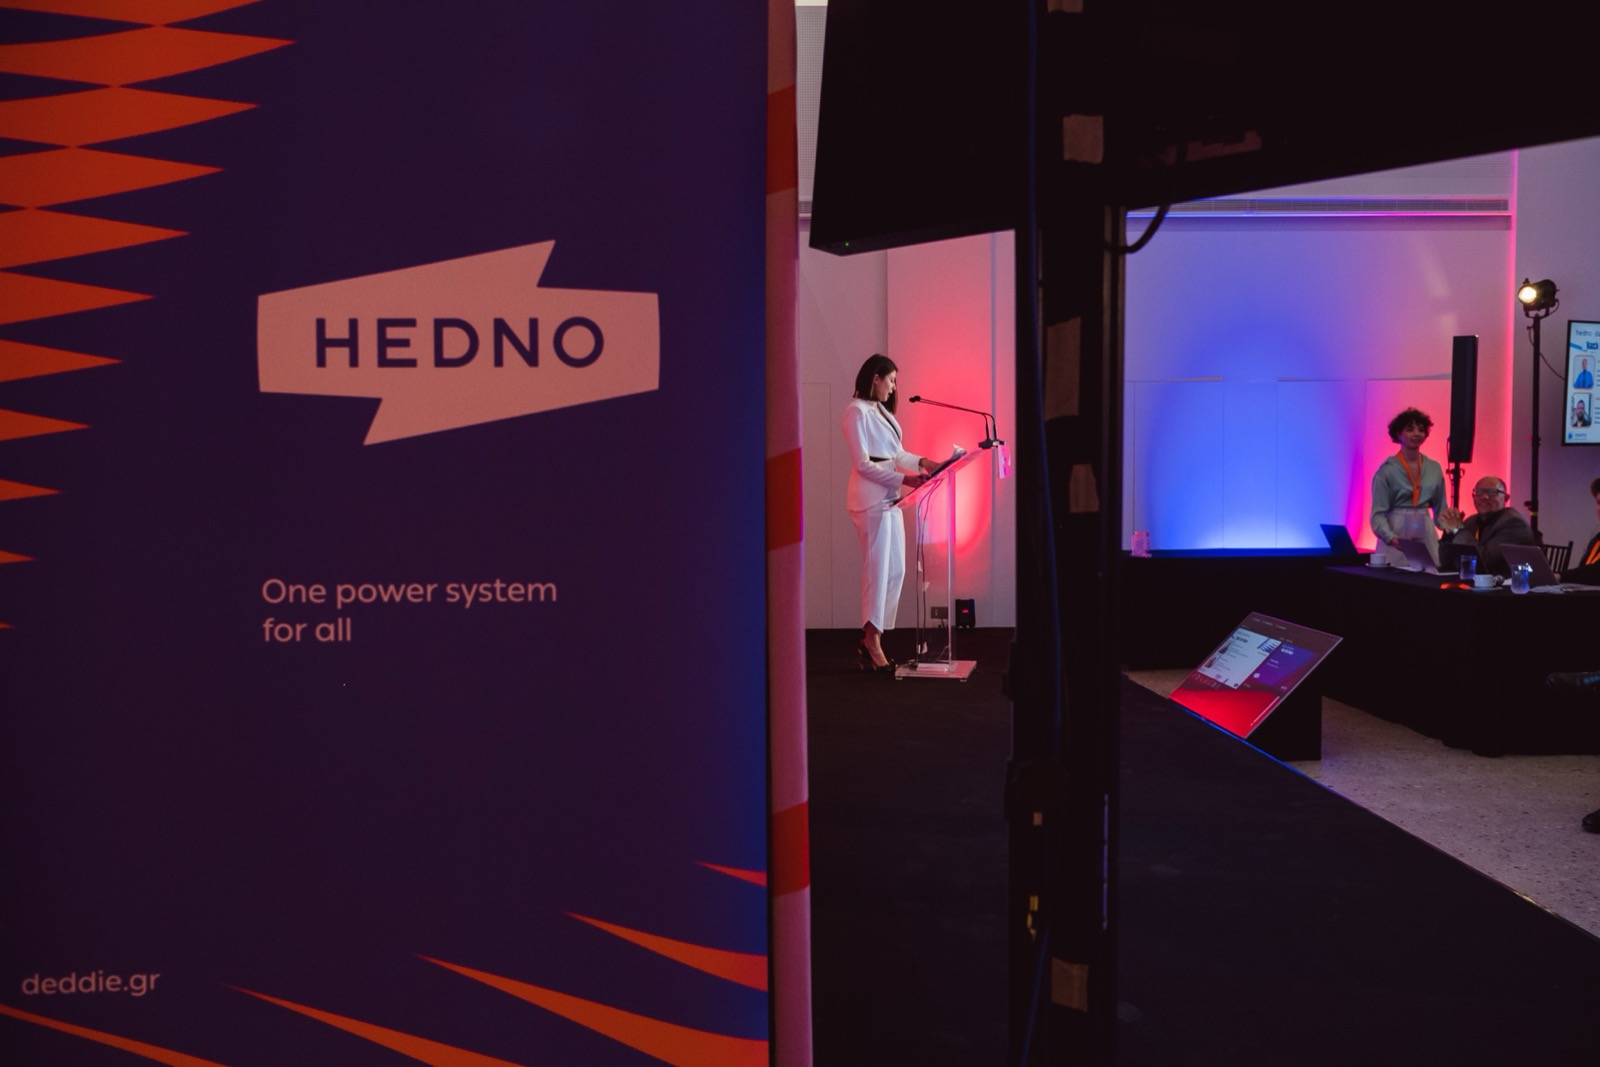
Final presentation
The six-minute pitch that won the prize.
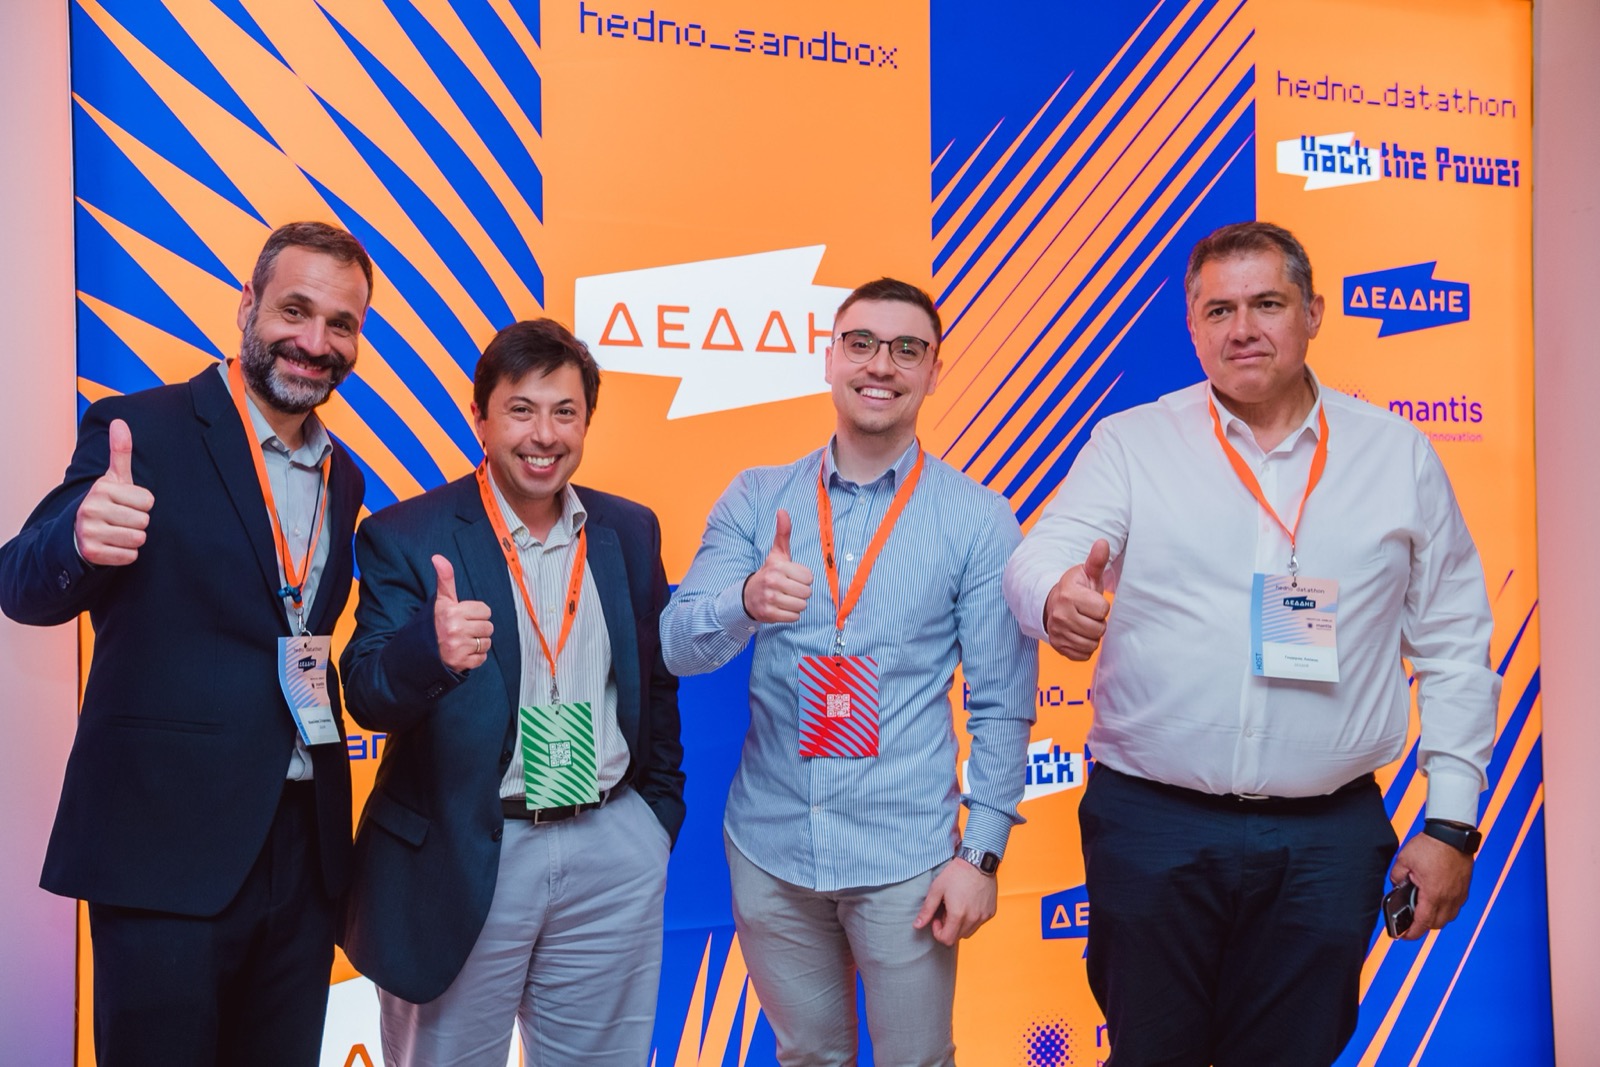
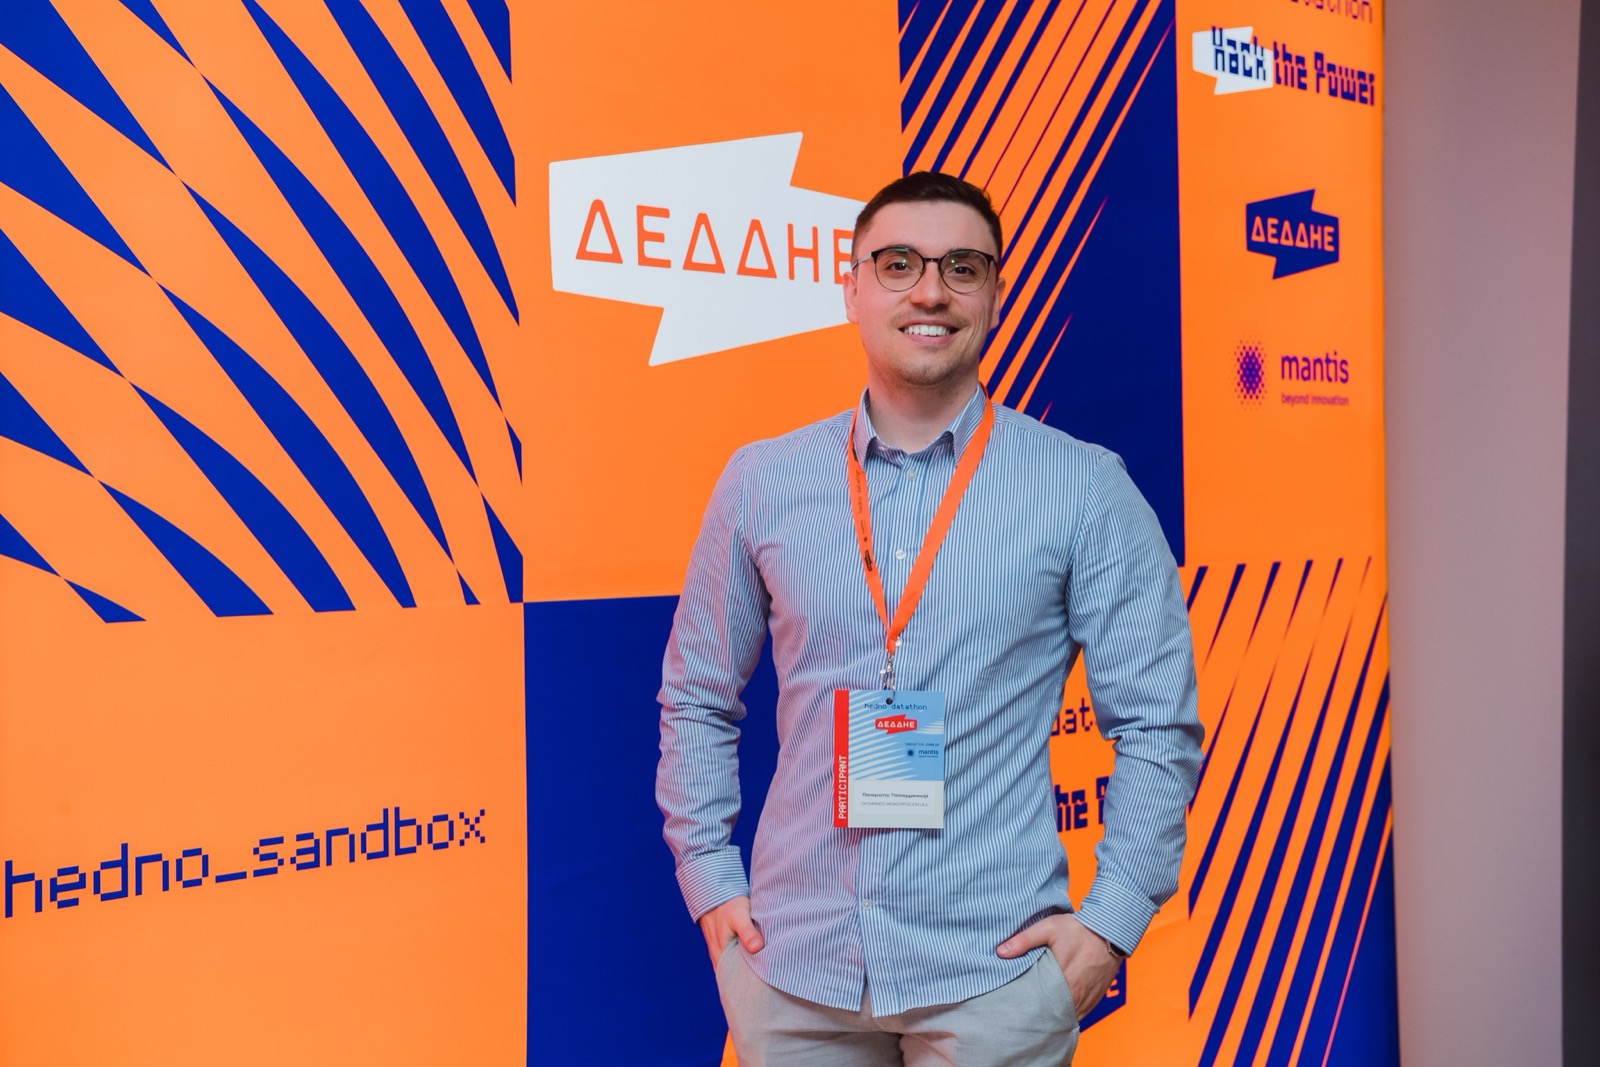
Panagiotis presents the full solution to the jury: how the five datasets were cleaned and joined, the features that describe theft, the LightGBM model and how it was validated, and how HEDNO would put the ranking to work. In Greek.
The result
One of three winning teams, out of 267.
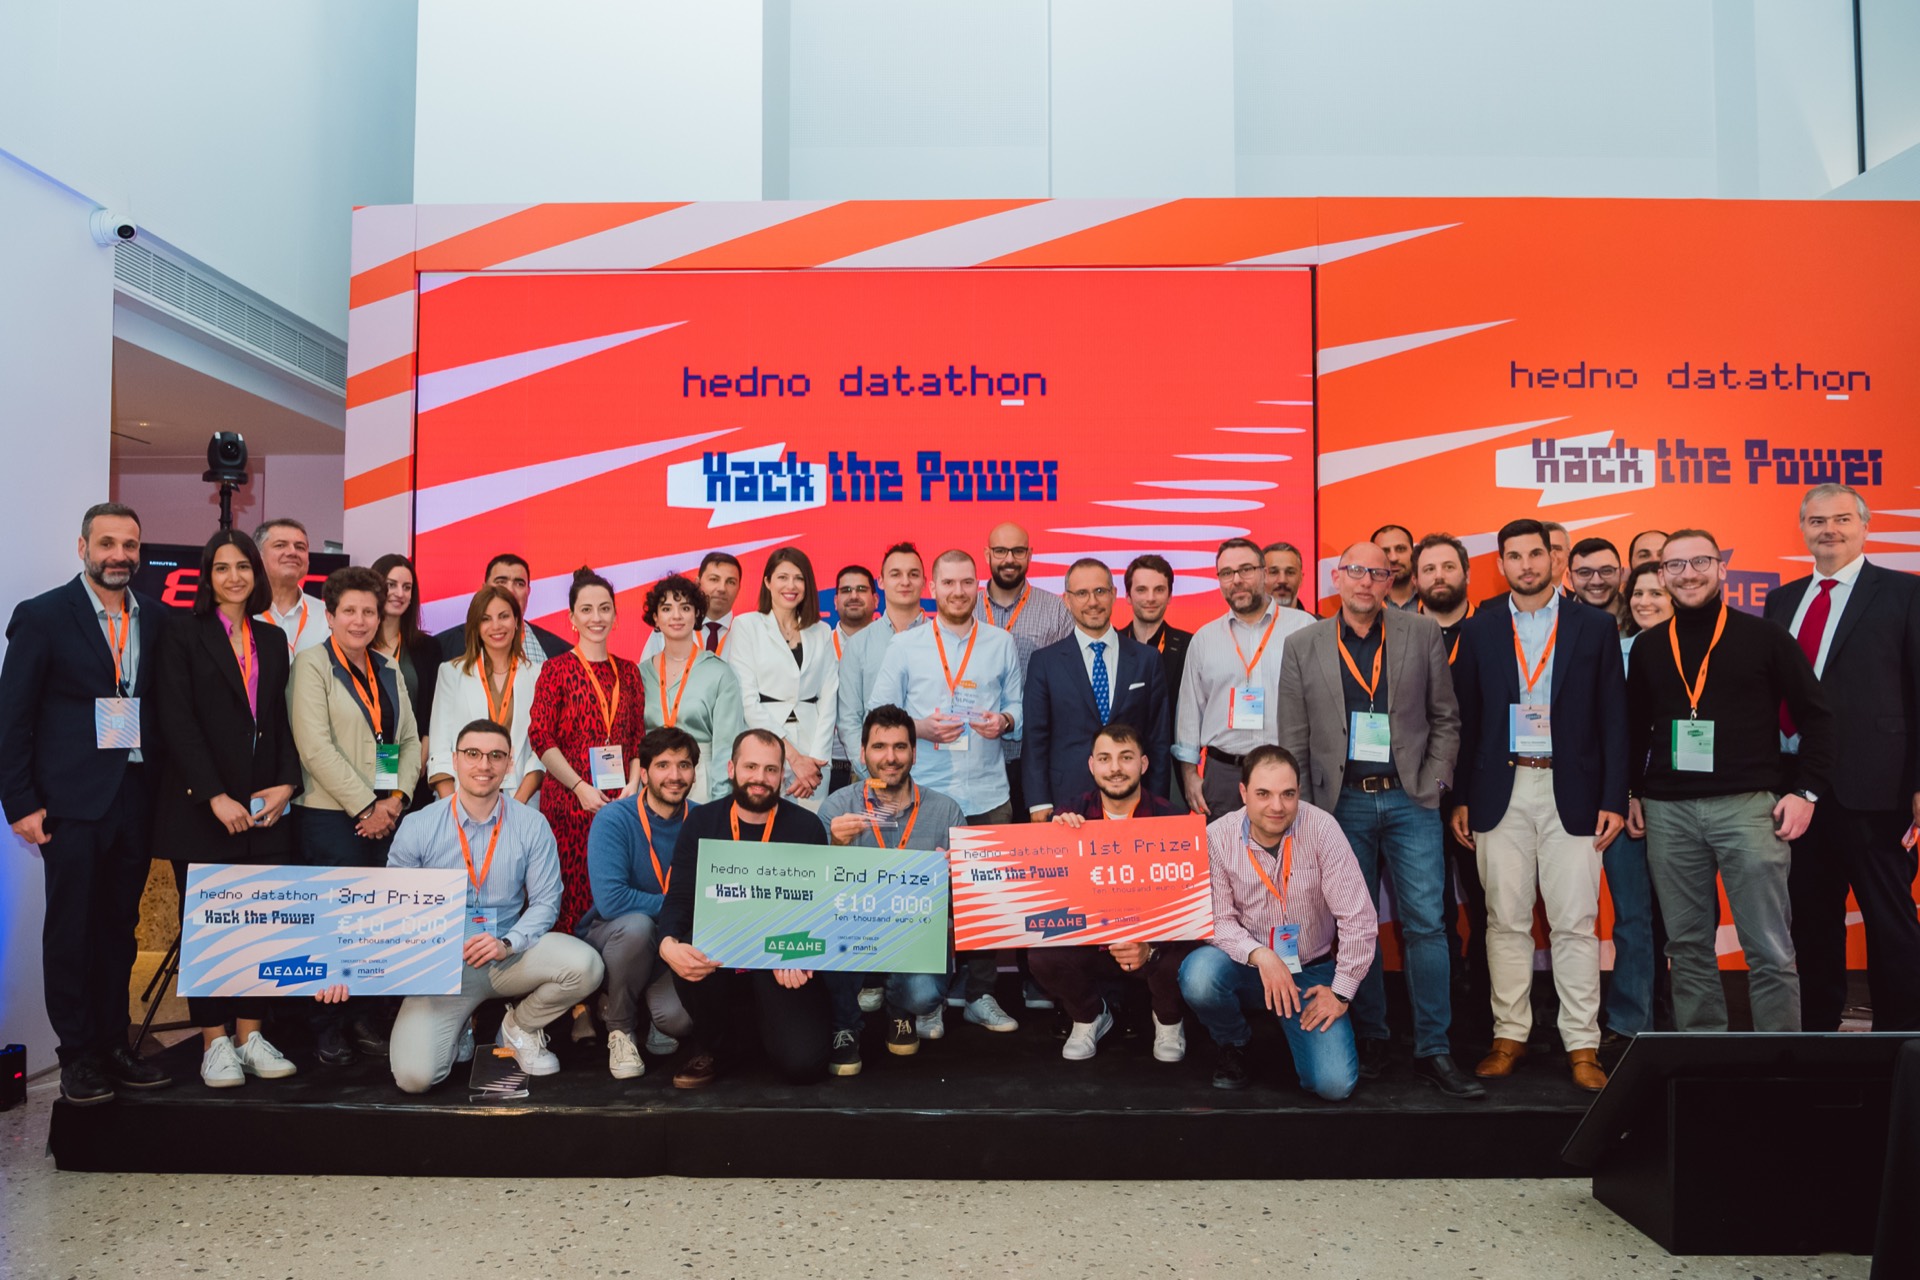
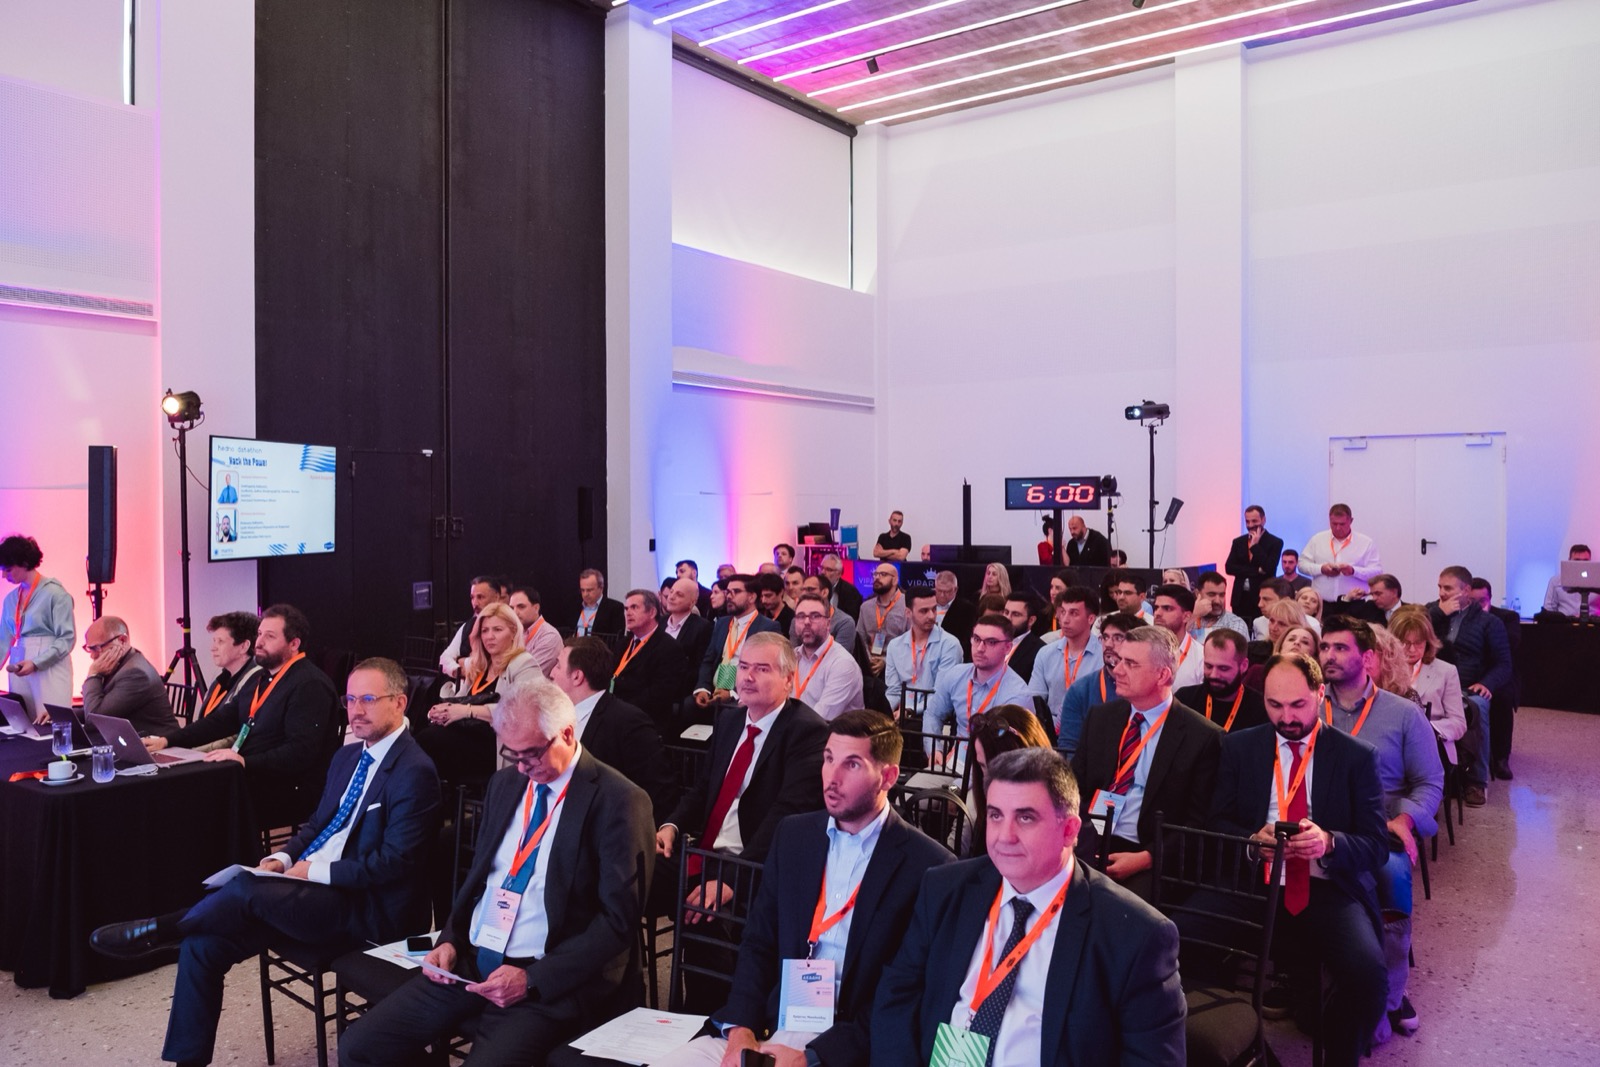
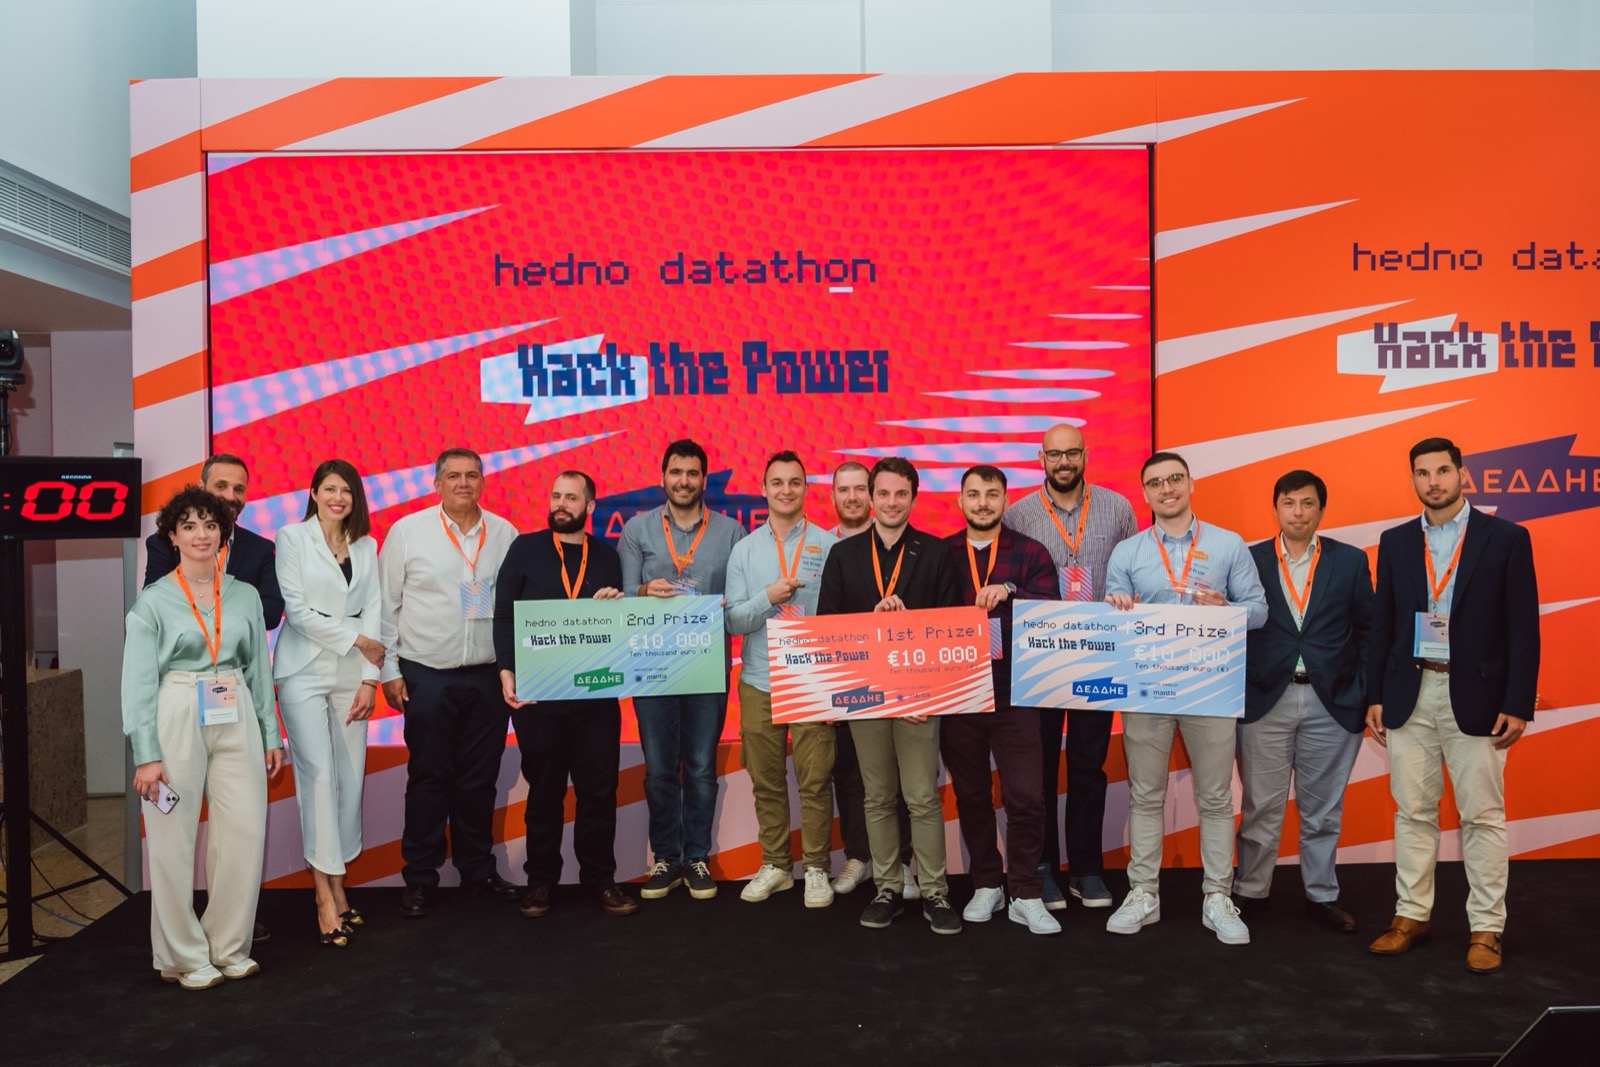
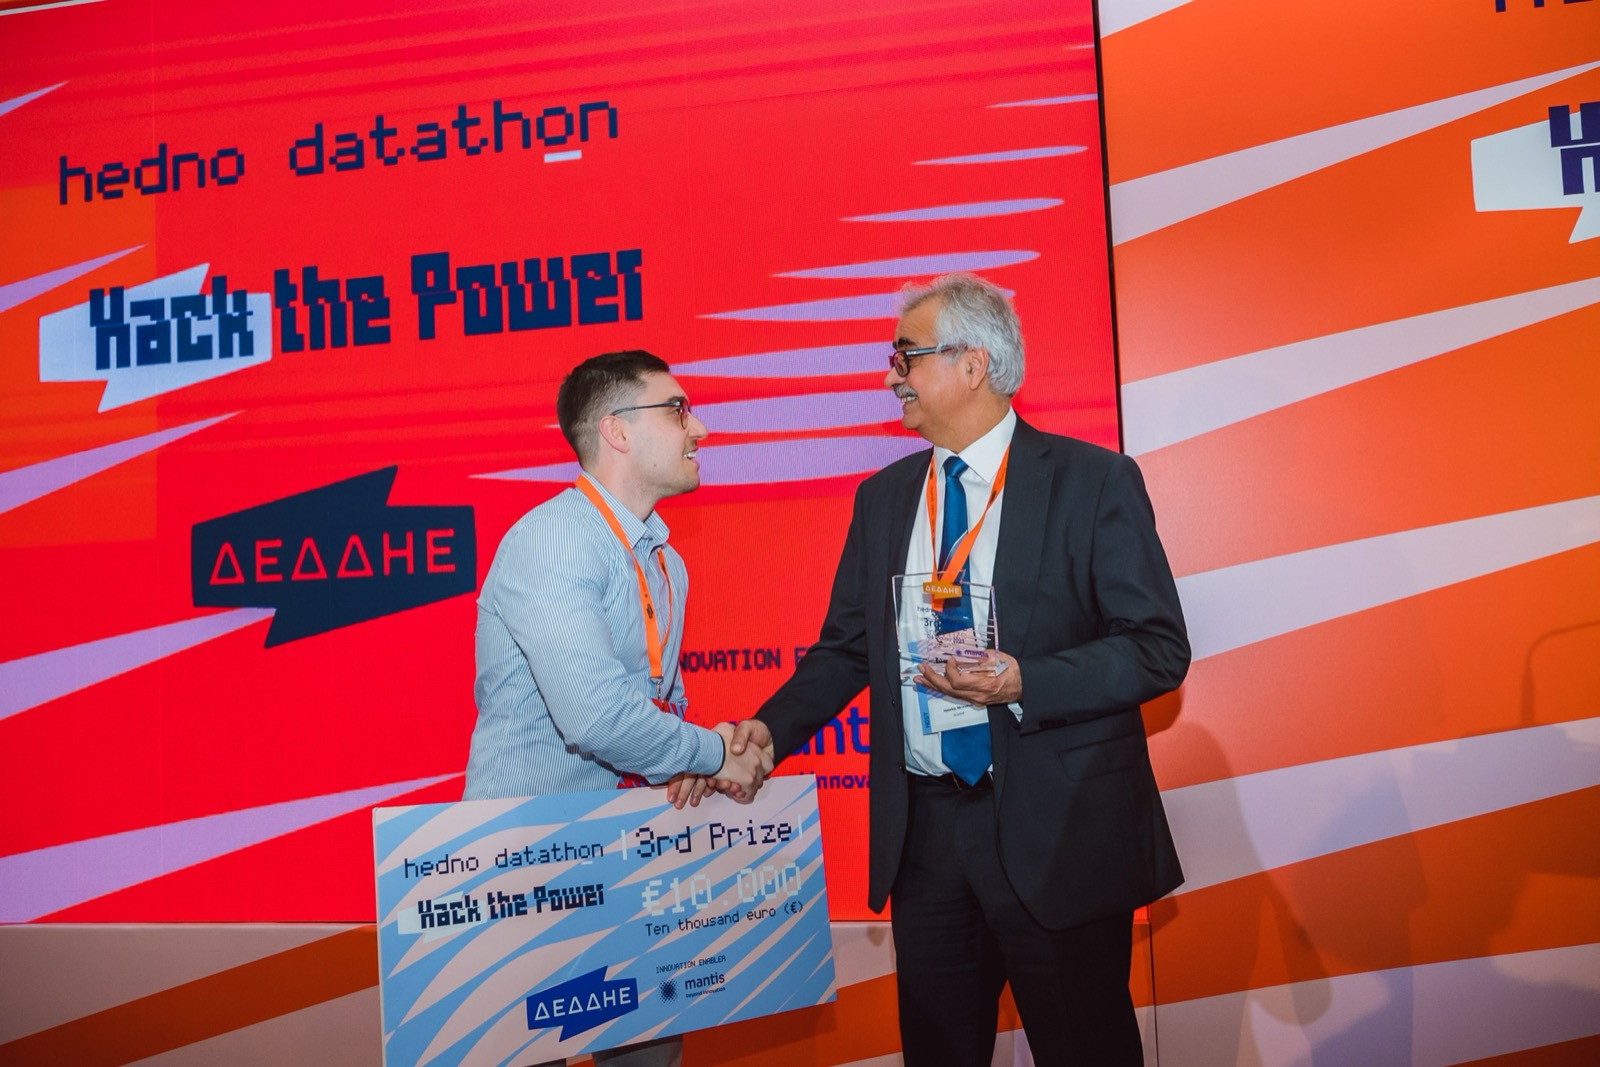
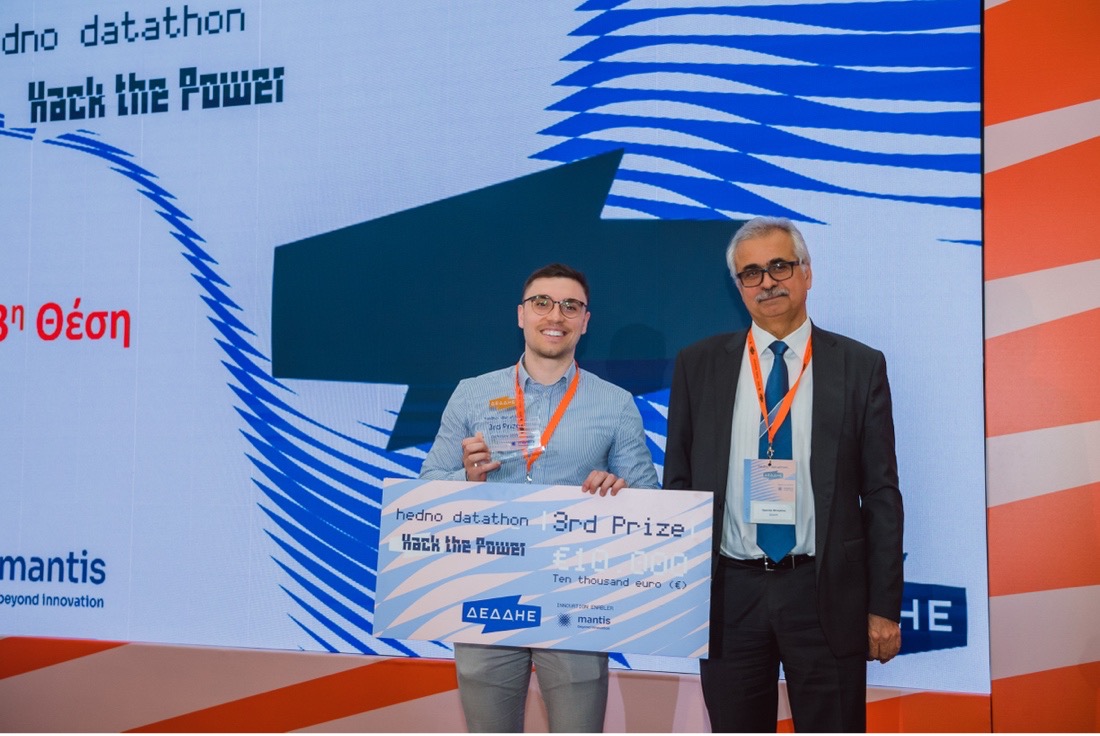
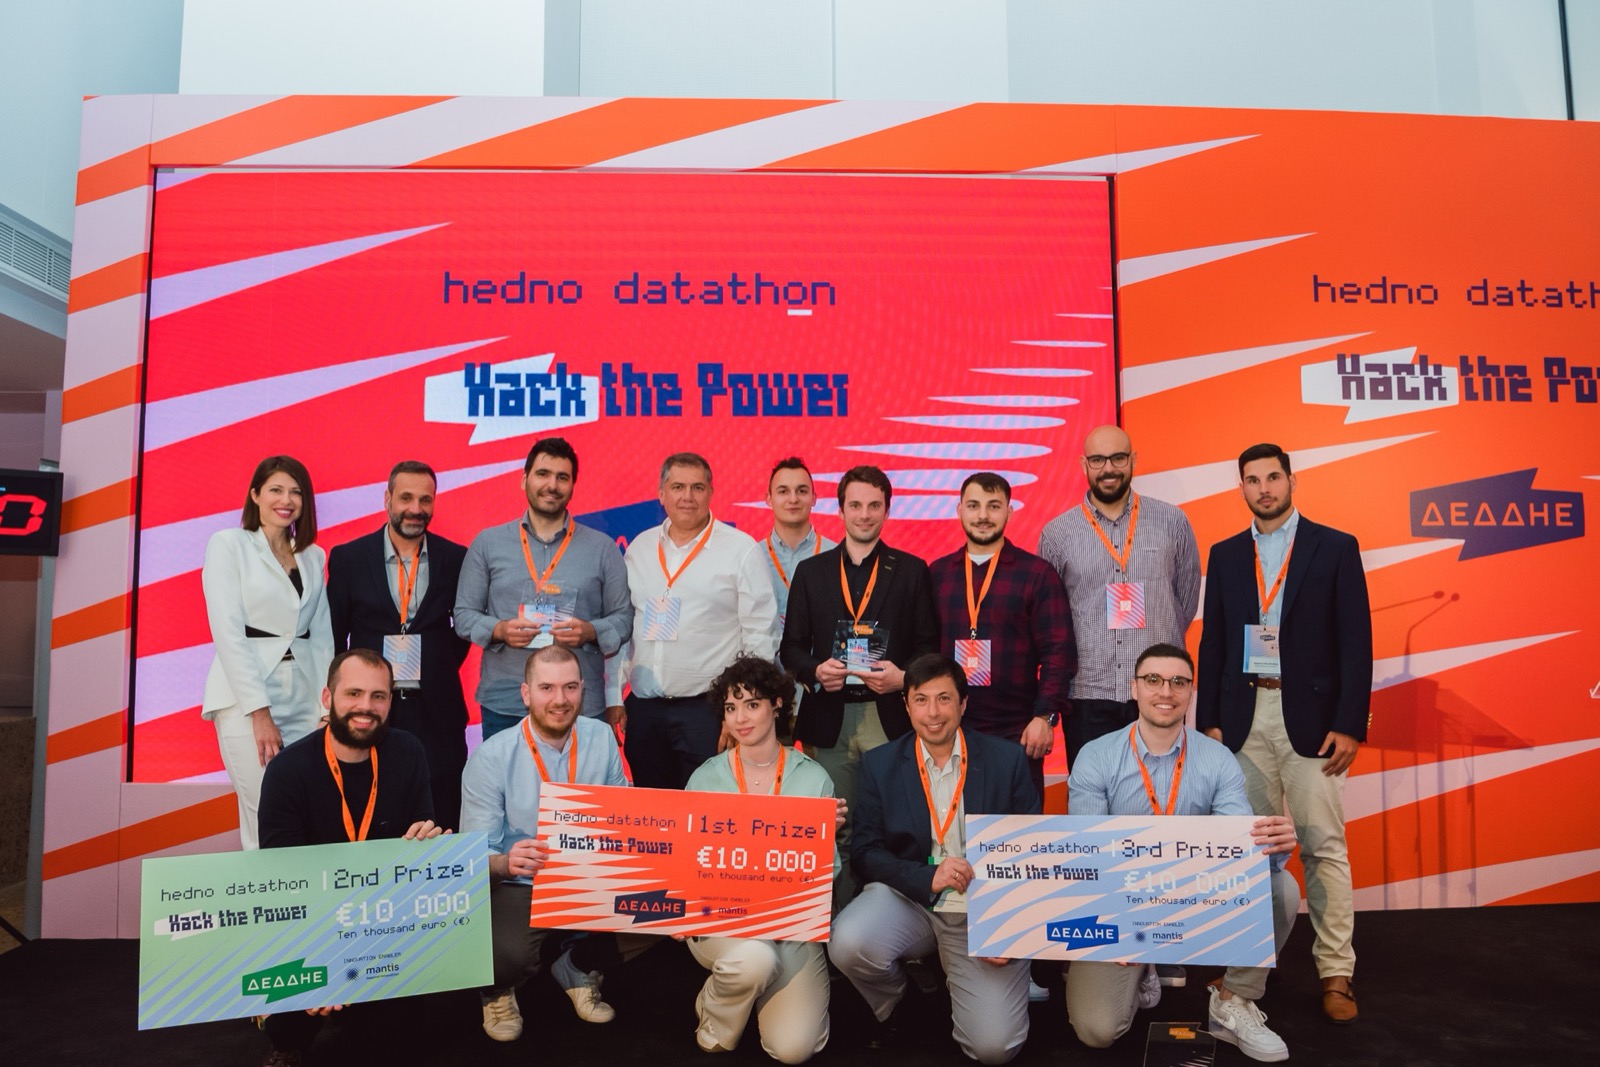
Ten finalists presented in Athens on 4 May 2023 to a jury of four professors. Three prizes of €10,000 were awarded. The third went to DataMinds, ahead of research labs, startups and established engineering firms.
The final was judged on the model first, at 70% of the score, and on method and applicability at scale for the rest. That order suits us. A ranking that holds up on a hidden test set is the part that survives contact with a real grid.




The challenge
Theft that hides inside 7.4 million meters.
HEDNO runs the medium and low-voltage network for the whole of Greece, the fifth largest distribution operator in the European Union. Energy taken without being metered or billed rose from 0.2% of what the network delivered in 2003 to 4.4% in 2019, while the European average fell. Every inspection costs a field crew a day, and most of them find nothing.
The datathon asked one question. Given what the operator already knows about a supply point, how likely is it that someone is stealing power there? The answer had to be a ranking, so that the first inspections on the list are the ones most likely to find something.
The data
Five tables, one verdict per supply point.
Everything arrived as raw CSV from the sandbox. Preparing the inputs and the labels was part of the competition, not a given.
1.2M rows
Supply records
Contract capacity, voltage level, type of use and the coordinates of every supply point.
1.2M rows
Supplier representations
Which electricity supplier served each customer and when, from 1983 to 2022. Switching behaviour lives here.
9.2M readings
Consumption readings
Four years of real meter readings for one region of Athens, taken roughly every four months on an irregular calendar.
2.3M requests
Customer requests
Reconnections, disconnections, supplier changes and new connections, 2012 to 2022, with how each one was resolved.
3,841 cases
Confirmed thefts
Every power theft HEDNO confirmed between 2011 and 2022. The labels, and the only ground truth.
The needle
2,547
confirmed thefts among 316,358 supply points. Fewer than one in a hundred.
A model that flags everyone is useless. A model that lifts the right 1% to the top is worth a great deal.
How we built it
Understand the data first. Then model it.
The rules allowed anything: deep learning, pre-trained models, expensive GPUs. We bet on the unglamorous parts. On tabular data a well-fed gradient boosting model beats a neural network, and nothing beats knowing the data.
01
Clean the data before anything else
Accounts that appeared in both the training and the test set. Placeholder dates from 1995. Supply points with several meters and several tariffs. Overlapping supplier records. Each one was found, documented and handled before a single model ran. We sent the organisers our questions, and kept building while we waited for answers.
02
Fold five tables into one row per supply point
Predictions were due per supply point and customer, so every table was reduced to that grain: the contract, the supplier history, the consumption trajectory and the requests on file, joined into a single view the model could learn from.
03
Engineer features that describe behaviour
How consumption moved over time and where it dropped. How regularly the meter was read. How often the supplier changed. Which requests came in and how they ended. How the contracted capacity compares with the energy actually used. Hand-written rules covered the patterns investigators already recognise.
04
Gradient boosting, validated the way the judges score
LightGBM on a GPU, tuned with cross-validation against a split held out from day one, and scored with the competition metric itself, so a gain in our notebook meant a gain on the leaderboard. Error analysis fed each round of features. An ensemble of the strongest runs went into the final submission.
05
Rank, do not just classify
The output is a queue: every supply point ordered by its likelihood of theft. Inspections start at the top and stop when the budget runs out. That is the shape a distribution operator can actually use.
The engineering behind the ranking, and what carries to other detection problems, is in our articleFinding power theft across a national grid.
Timeline
Eight weeks, start to submission.
Week 1 · 20 Feb
Environment, repository, first data drop. It had bugs; the corrected files followed a week later.
Week 2
Exploration and visualisation. Literature on non-technical loss detection.
Week 3
Organisers' workshop. A small app to look at consumption curves. First features. Questions about the data sent to HEDNO.
Week 4
Feature engineering. First LightGBM model. Cross-validation pipeline and hyperparameter tuning.
Week 5
Error analysis. Helper tables and an FAQ from HEDNO answered most of the open questions.
Week 6
The helper tables folded into the features: tariff, contracted capacity, type of use and supplier as proper lookups. Full retrain and a fresh cross-validation run.
Week 7
More features. Ensembling. Model selection. Features for the test set, predictions, submission.
Week 8
Two days of safety margin, spent cleaning the code.
Losses hiding in your data?
Grids, water networks, payments, claims. If you have more cases than your team can inspect, we build the system that ranks them. First results in weeks.