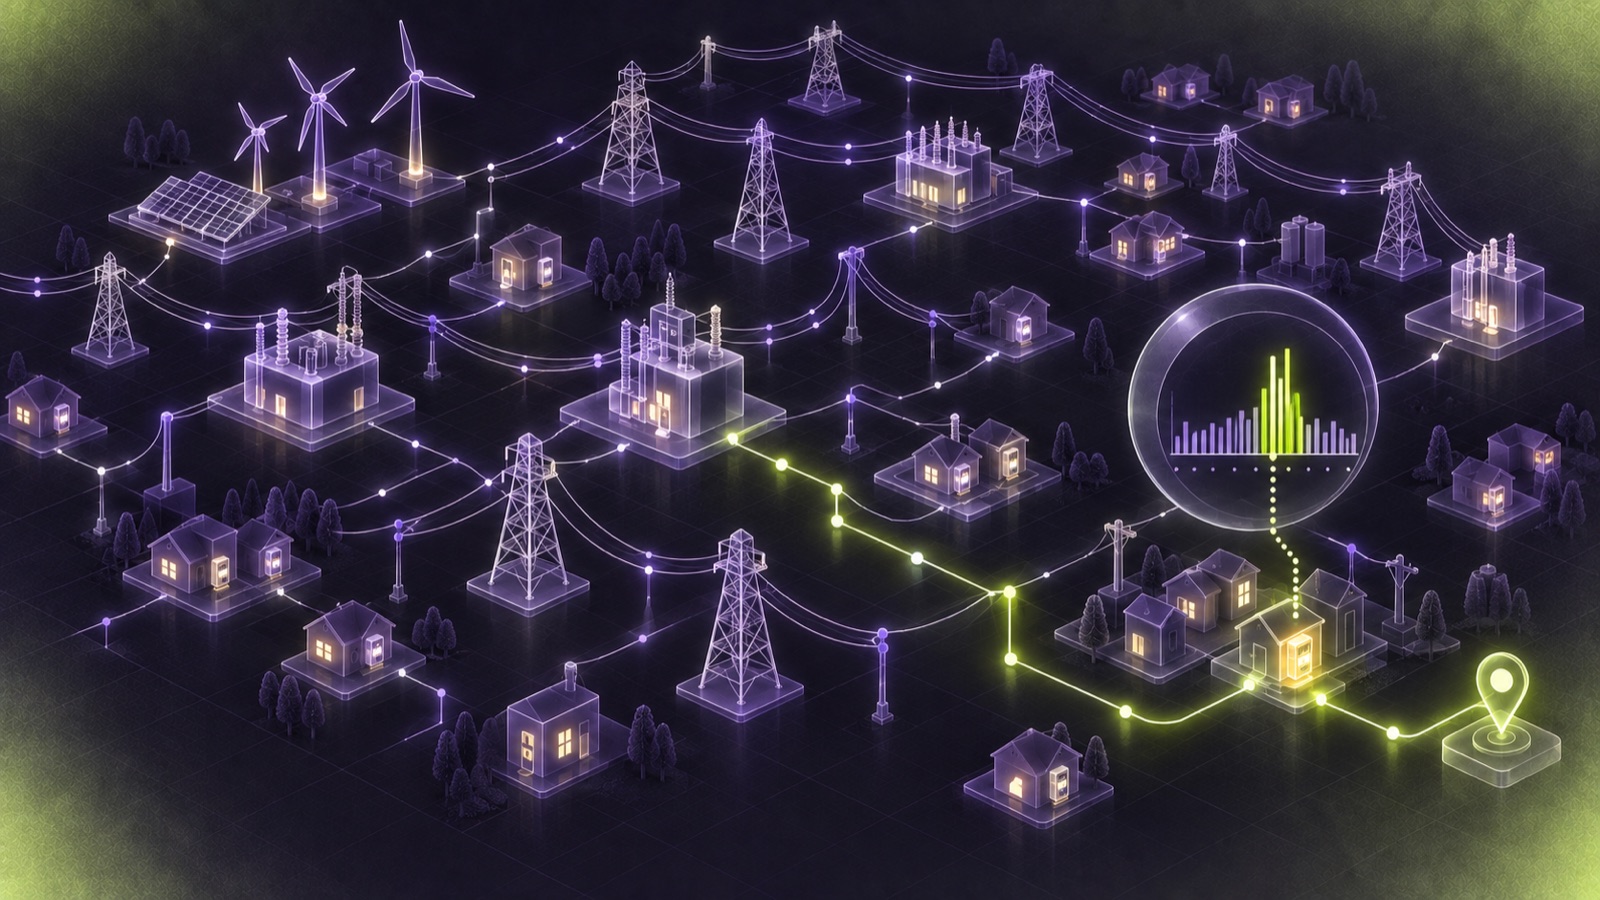
How we built a system that ranks suspected non-technical losses for HEDNO, and the lessons that carry to any detection problem with few confirmed cases.
Every distribution operator loses energy it never bills. Some of it is physics: resistance in the lines, transformers running warm. The rest is people: bypassed meters, tampered registers, connections that were never declared. The industry calls the second kind non-technical losses, and the problem with them is scale. HEDNO, the Greek distribution operator, runs a network far larger than any field crew could inspect, so the question was never “is there theft?” but “where should the crews go on Monday?” This is what it took to answer that.
The data was more interesting than the model
Consumption records are the obvious input, and they are enough to start. But the signal is rarely in the absolute number. It sits in the shape: a household whose consumption fell by half the month a new tenant moved in and never recovered, a shop whose readings stopped following the seasons, a meter that reports the same round figure every cycle.
So the first weeks went into features that describe shape. Ratios against the customer’s own history. Ratios against similar customers in the same area and tariff. Changes that coincide with meter replacements or contract events. The list grew with every conversation with investigators, who had been spotting these patterns by eye for years and had never been asked to write them down.
Almost no labels, and the ones we had were biased
A detection project sounds like a classification problem. It is not, at least not at first. Confirmed cases were few, and they were the cases someone had already found using the old method, which meant a model trained on them would learn to find what the old method found and nothing else.
The way through was to start unsupervised. Isolation forests and simple statistical outlier scores over the shape features produce a ranked list without any labels at all. The list is noisy, but it is a list, and a list is something investigators can act on. Every inspection they made came back as a label: confirmed, dismissed, or inconclusive. After a few rounds there were enough of those to train a supervised model, with LightGBM doing the ranking and the unsupervised scores demoted to features. The system got sharper with every case the team closed, and the labels it learned from were its own.
Rank, do not classify
The most important design decision was to never output a yes or no. The system outputs a score and an ordering, and the number of cases at the top of the list that become inspections is set by the crews’ capacity, not by a threshold the model picked. We agreed that budget with the client up front: this many inspections per region per week.
That framing changes the metric. Accuracy is meaningless when the base rate is tiny. What matters is the hit rate inside the budget: of the visits the system recommended, how many found something. That is a number the field teams understand and one that management can compare against the old way of choosing visits.
Every alert needs a reason
An inspector who is handed an address and a score will, quite reasonably, ignore it. An inspector who is handed an address, a score and “consumption dropped 60% in March 2024 and has not tracked the neighbourhood since” will go and look. We attached the top factors behind every score using SHAP, translated into plain sentences, and showed them next to the case in the queue.
This did two things. It made the queue usable. And it made the model auditable: when a score looked wrong, the reasons showed why, and more than once that led us to a data quality problem rather than a modelling one.
The pipeline is most of the work
Consumption data arrives on its own schedule, with corrections that rewrite history weeks later. The pipeline had to treat every reading as “as of” a date, recompute features when corrections landed, and never let a future correction leak into a past score during backtesting. Scores are computed on a schedule, queued in PostgreSQL, served to the investigation tool through a small FastAPI service, and every score, explanation and outcome is logged for audit. Grafana dashboards track input volumes, score distributions and the hit rate per region, because the day a source system changes a field is the day the model quietly stops working.
What carries to other detection problems
Payment fraud, claims fraud, procurement anomalies and sensor faults all share the same structure: rare events, few reliable labels, a limited number of humans who can check things. The same pattern applies. Start unsupervised so you have a list on day one. Let the humans’ decisions become your labels. Rank against a capacity budget rather than classifying against a threshold. Attach reasons to every alert. Log everything.
The short version
Detection is a queue-building problem, not a prediction problem. Build the queue first, size it to the people who will work it, explain every item in it, and let their answers train the next version.
The project itself, with the numbers, the jury and the timeline, is on the case page: Finding power theft across a national grid.